
 English
 Español
 Français

Surface roughness is a key factor in product quality and performance. It affects friction, wear, sealing, coating adhesion, corrosion behavior, and visual appearance. In manufacturing, roughness is typically quantified by standardized surface parameters—most commonly Ra—to ensure consistent specifications, inspection, and process control.
In this guide, you’ll learn what surface roughness means, how it is measured, and how to select an appropriate surface finish for your application.
What is Surface Roughness (Ra)?
Surface roughness describes the small-scale peaks and valleys left on a surface after a manufacturing process (machining, cutting, grinding, casting, etc.). These micro-irregularities are normal—but their size and pattern can strongly influence how the part performs.
Ra (Arithmetic Average Roughness) is the most widely used roughness parameter. It represents the average absolute deviation of the surface profile from the mean line over a specified evaluation length. In simple terms, lower Ra = smoother surface, and higher Ra = rougher surface.
What is Surface Finish?
Surface finish is a broader term than roughness. It describes the overall surface condition after fabrication and may include:
surface texture and roughness level
waviness and lay direction
visual appearance (matte, satin, bright)
functional properties (sealing, friction, coating readiness)
In many industries, surface finish requirements are tied directly to product performance and reliability.
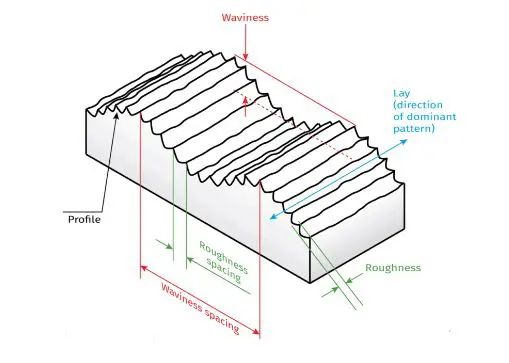 The Basics of Surface Finish Illustration
Units for Surface Roughness
Ra is the most common “general-purpose” indicator of surface roughness.
Units: micrometers (µm) or microinches (µin).
Rz (Average Maximum Height)
Rz represents the average peak-to-valley height over multiple sampling lengths. It is more sensitive than Ra to occasional high peaks or deep valleys.
Units: µm or µin.
Rq (Root Mean Square Roughness)
Rq is the root mean square average of the profile height deviations. It is closely related to Ra but slightly more sensitive to large deviations.
Units: µm or µin.
Rp (Maximum Peak Height)
Rp is the height of the highest peak within the sampling length.
Units: µm or µin.
Rv (Maximum Valley Depth)
Rv is the depth of the deepest valley within the sampling length.
Units: µm or µin.
| Ra (µm) | Rq (µm) | Rp (µm) | Rv (µm) |
|---|---|---|---|
| 39.3 | 46.1 | 156.6 | 71.5 |
| 38.4 | 45.7 | 150.0 | 70.1 |
| 40.8 | 46.5 | 158.8 | 71.2 |
Surface roughness parameters (µm)
Why Surface Roughness Matters in Manufacturing
Surface roughness directly influences function, manufacturing cost, and customer perception:
Functionality and performance
Many mechanical components (bearings, gears, sliding surfaces) require controlled roughness to reduce friction losses and improve reliability.
Friction, wear, and lubrication (tribology)
Roughness affects how surfaces contact, wear, and retain lubricant films. Proper control can reduce wear and extend service life.
Sealing and contact surfaces
Sealing surfaces in automotive, aerospace, and fluid systems often require a specific roughness range to prevent leakage and maintain integrity.
Manufacturability and downstream processing
Roughness impacts coating, plating, polishing, and adhesive bonding. The “right” roughness can improve process stability and yield.
Quality control and inspection
Roughness parameters are part of many drawings and standards. Consistent measurement ensures parts meet design requirements.
Aesthetics and consumer perception
For consumer-facing products, surface feel and appearance strongly influence perceived quality.
Corrosion resistance
Surface texture can influence corrosion initiation and coating performance, especially in harsh environments.
Cost optimization
Achieving a lower Ra usually requires additional processing (more finishing steps, finer abrasives, slower feeds), so roughness should be specified based on functional needs—not “as smooth as possible.”
Surface Roughness Symbols and Terminology
Surface roughness parameters are standardized (commonly referenced under ISO/ANSI systems). Below are the most common terms:
Ra: arithmetic average roughness
Rz: average peak-to-valley height
Rq: RMS roughness
Rp: maximum peak height
Rv: maximum valley depth
Units are typically µm or µin (microinch).
 An Image of Terminologies and symbols to describe surface roughness and its patterns
Typical Ra Ranges by Manufacturing Process
Ra values vary widely by process, tooling condition, material, and parameters. The ranges below are general references—not guaranteed results.
Machining
Turning / milling: often around 0.8–6.3 µm Ra
Grinding: often around 0.1–1.6 µm Ra (precision grinding can be smoother)
Sheet metal cutting
Laser cutting: can vary widely depending on power, speed, and gas
Waterjet cutting: typically rougher; abrasive type and pressure matter
Welding
TIG welding: often smoother than MIG due to better oxidation control
MIG welding: typically higher roughness; parameters and shielding gas matter
Casting
Sand casting: usually rough (wide range)
Investment casting: generally smoother than sand casting
Die casting: can achieve relatively smooth surfaces compared to sand casting
Tip: If you need a quick reference chart, link this section to your Surface Roughness Comparison Chart (Ra) page.
Typical ranges vary by material, tooling, and process settings. Use as a quick reference
| Process | Typical Ra (µm) | Typical Ra (µin) | Typical Application / Notes |
|---|---|---|---|
| Drilling | 6.25 – 1.60 | 246 – 63 | General holes; burrs often at hole exit—deburring usually required. |
| Milling | 6.25 – 0.80 | 246 – 31 | General machining; finish depends heavily on tool sharpness and feed. |
| Turning | 6.25 – 0.40 | 246 – 16 | Shafts and rotational parts; can reach finer Ra with stable setup and finishing passes. |
| Broaching | 3.20 – 0.80 | 126 – 31 | Keyways/splines; good consistency in production. |
| Reaming | 3.20 – 0.80 | 126 – 31 | Hole sizing + improved finish; used when fit and surface quality matter. |
| Grinding | 1.60 – 0.10 | 63 – 4 | Precision sizing and improved finish; common for hardened parts. |
| Honing | 0.80 – 0.10 | 31 – 4 | High-precision bores (cylinders, hydraulic parts); improves geometry and surface. |
| Polishing | 0.40 – 0.10 | 16 – 4 | Cosmetic finish and reduced friction; often used before plating/coating. |
| Lapping | 0.40 – 0.05 | 16 – 2 | Very flat sealing surfaces; tight tolerance and high contact ratio. |
| Superfinishing | 0.20 – 0.025 | 8 – 1 | Bearings/gears; very low friction and high fatigue performance surfaces. |
| Electro-plating | 0.80 – 0.10 | 31 – 4 | Final surface depends on base finish + coating thickness; used for corrosion protection/appearance. |
| Sand Casting | 25.0 – 12.5 | 984 – 492 | Rough “as-cast” surfaces; usually needs machining or finishing for functional faces. |
| Investment Casting | 3.20 – 1.60 | 126 – 63 | Better as-cast finish; often used for near-net-shape parts. |
| Die Casting | 1.60 – 0.80 | 63 – 31 | Good surface for high volume; may still need deburring at parting lines. |
| Forging | 12.5 – 3.20 | 492 – 126 | Scale/texture common; machining/finishing often required on critical areas. |
| Extruding | 3.20 – 0.80 | 126 – 31 | Profiles; finish varies with die condition and alloy. |
| Laser Cutting | 6.25 – 0.80 | 246 – 31 | Edge roughness varies by power/spe |
How Mass Finishing Achieves Your Target Ra — Real Case Data
Unlike CNC machining alone, mass finishing — vibratory, centrifugal disc, or centrifugal barrel — can reduce surface roughness by 70–90% in a single automated batch cycle. No manual polishing, no operator variation, and consistent Ra results across thousands of parts per run. The following data is from an actual Inovatec production test.
Verified Production Case: Stainless Steel 304 Disc Parts
Process: Vibratory deburring machine tumbling
Media: GC ceramic ACT 20 × 20 mm (¾ inch)
Cycle time: 60 minutes
| Ra Before | Ra After | Roughness Reduction | Material Removal | Batch Consistency |
|---|---|---|---|---|
| 1.0 µm | 0.18 µm | 82% | <0.3% | ±1% surface uniformity |
Full process specifications:
| Parts Material | Processing Time | Media Type | Media Wear Rate | Material Removal | Consistency |
|---|---|---|---|---|---|
| Stainless steel 304 | 60 min | GC ceramic ACT 20×20 mm | 0.5‰ per hour | <0.3% (minimal dimensional impact) | ±1% surface uniformity |
Inovatec Mass Finishing Ra Capability — by Process
| Process | Achievable Ra | Typical Application |
|---|---|---|
| Vibratory finishing (bowl / tub) | 0.1 – 1.6 µm | Deburring, general surface refinement, large batches |
| Centrifugal disc finishing | 0.05 – 0.8 µm | Precision small parts, fast 10–20 min cycles |
| Centrifugal barrel finishing | 0.025 – 0.4 µm | High-precision parts, tight Ra tolerance (<0.1 µm) |
| Isotropic superfinishing (REM process) | <0.1 µm | Gears, bearings, aerospace and motorsport components |
| CNC turning / milling (standard, for reference) | 1.6 – 6.3 µm | As-machined finish, general parts |
| Cylindrical / surface grinding (for reference) | 0.4 – 1.6 µm | Flat and cylindrical precision surfaces |
What Affects Achievable Ra in Mass Finishing
Media type and grit: Finer grit and smaller media contact more surface area, producing lower Ra values. GC ceramic is standard for steel alloys; plastic media is preferred for softer aluminum and brass parts.
Cycle time: Most target Ra values are reached within 30–90 minutes. Longer cycles reduce Ra further but with diminishing returns after the initial peak-removal phase.
Finishing compound: Compounds control cutting action and protect parts from re-scratching. Burnishing compounds are used in final-stage runs when targeting Ra below 0.2 µm.
Machine type and G-force: Centrifugal barrel machines generate up to 25G compared to vibratory at 3–5G, enabling sub-0.1 µm Ra on precision parts that vibratory finishing cannot reach.
Need to Hit a Specific Ra on Your Parts?
Tell us your material, current Ra, and target Ra — we will recommend the right machine and media, and share reference data from similar parts we have already processed.
How to Measure Surface Roughness
Manufacturers typically measure roughness with instruments such as a profilometer (stylus type) or optical surface measurement equipment. A common workflow:
Select the measurement area
Choose a representative location based on functional surfaces and drawing requirements.Clean the surface
Remove oil, debris, or residue that could distort measurement results.Choose the correct stylus/probe
Select a tip radius and measurement method appropriate for the expected roughness.Set measurement parameters
Define evaluation length, cutoff wavelength, and sampling conditions to ensure repeatability.Calibrate the instrument
Follow the manufacturer’s procedure to ensure accuracy.Perform the measurement and analyze data
Record Ra (and other required parameters such as Rz/Rq), and compare against specification limits.Repeat for confidence
Measure multiple points to account for surface variability.Document results
Record parameters, location, and conditions for traceability and quality audits.
How to Choose the Best Surface Roughness for Your Project
Selecting a target roughness should balance performance with achievable manufacturing capability:
Functional requirements: friction, wear, sealing, and mating surface needs
Material properties: hardness, corrosion behavior, thermal effects
Industry standards: aerospace/automotive/medical requirements may define limits
Manufacturing process capability: machining vs grinding vs finishing steps
Environment: harsh conditions may need controlled finish for durability
Cost constraints: lower Ra often means higher cost
Aesthetics: consumer products may prioritize appearance and feel
Validation: prototype testing and inspection results should confirm suitability
More resources:
Tumble vs Vibratory Finishing – Source: INOVATEC
Effective Metal Finishing Technique – Source: INOVATEC
Top Tips for Metal Finishing – Source: INOVATEC
Surface Roughness – Source: WIKIPEDIA
Importance of Surface Roughness Analysis – Source: AZO MATERIAL
Surface Roughness Comparison Chart (Ra) – Source: INOVATEC
Ways to Remove Sharp Edges and Burrs from Metal Parts – Source: INOVATEC
Why is Deburring Important? – Source: INOVATEC